Color Bars is the most used Test Pattern.
At first it was defined in analog RGB signal format, then in composite NTSC/PAL/SECAM formats, then in analog component format (YPbPr aka YUV), and finally – in digital component RGB and YUV formats.
In accordance with ITU-R Recommendation BT.471 the nomenclature (type specification) of any color bars test pattern should consist of RGB levels as a percentage of Reference White in the following sequence:
White Bar / Black Bar / Max Colored Bars / Min Colored Bars.
For 100/0/75/0 “EBU Bars” the MathCAD RGB_Bars matrix in percents looks like this:
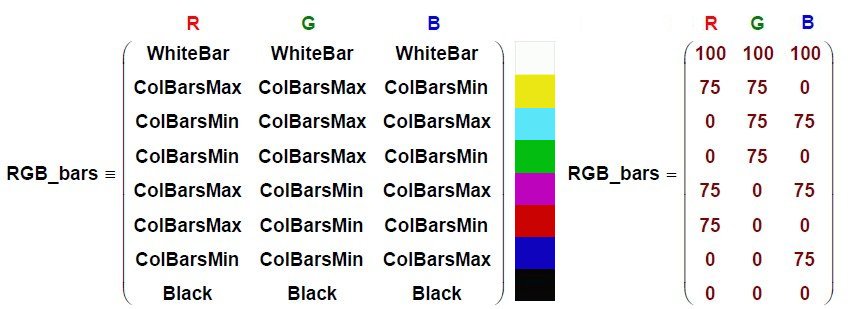
WhiteBar = 100, Black = 0, ColBarsMax = 75, ColBarsMin = 0.
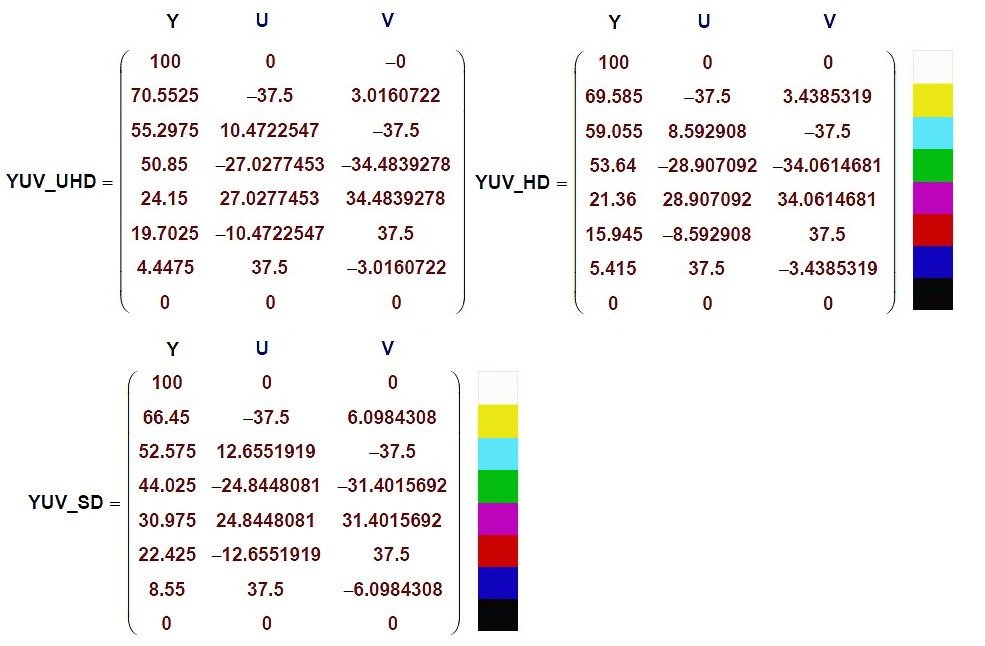
For any color space the relative YUV values in percents can be obtained as a product of multiplication of RGB_Bars matrix by the transposed RGB to YUV conversion matrix matching the selected YUV color space:
YUV_UHD = RGB_bars × Transpose(RGB2YUVUHD)
YUV_HD = RGB_bars × Transpose(RGB2YUVHD)
YUV_SD = RGB_bars × Transpose(RGB2YUVSD)
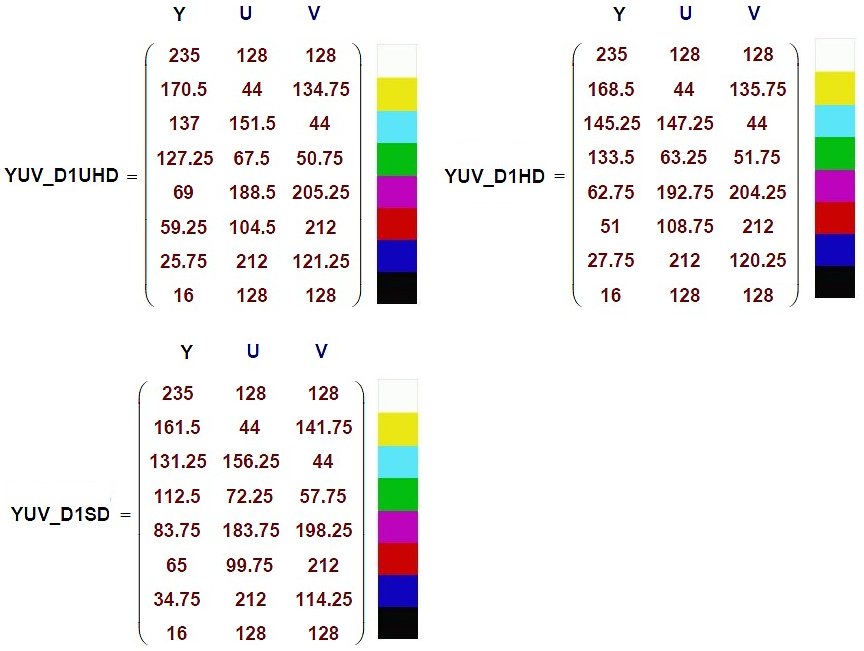
For practical applications we should convert the relative YUV values in percents to Narrow Range digital data levels.
To cover several bit depth cases it is convenient to present digital levels in “8 bit fractional” notation invented by BBC engineers; this notation is suitable for any numbers of bits.
Here we use its “10 bit as 8 bit fractional” variant, so .25 means one LSB increment of 10 bit value, 0.5 means two 10 bit levels, and 0.75 means three 10 bit levels added to 8 bit (MSB) value ×4:
The nomenclature of widely used SMPTE Bars is 75/0/75/0.
Thus, the only difference between SMPTE Bars and EBU Bars is the White Bar level. This 75% White Bar is often called “75% Gray” (strictly speaking, we should not call it “White”).
For six other (colored) bars the YUV values of SMPTE Bars are the same as shown in EBU Bars matrices above.
The 75% Gray Level plays important role, in 8 bit fractional notation its level is
16 + 0.75 × 219 = 180.25, so the 8 bit rounded level = 180.
The exact value of 75% Gray Level in 10 bit is
16 × 4 + 0.75 (219 × 4) = 721,
but for backward compatibility with 8 bit systems it is typically set to
180 × 4 = 720.
The Vectorscope shows you color Hue and Saturation; in math terms it means the UV Vector Angle in degrees and Length in percents.
See below the MathCAD calculated vector representation of EBU Bars UV values and how UV vectors look on VideoQ VQV analyzer screen:
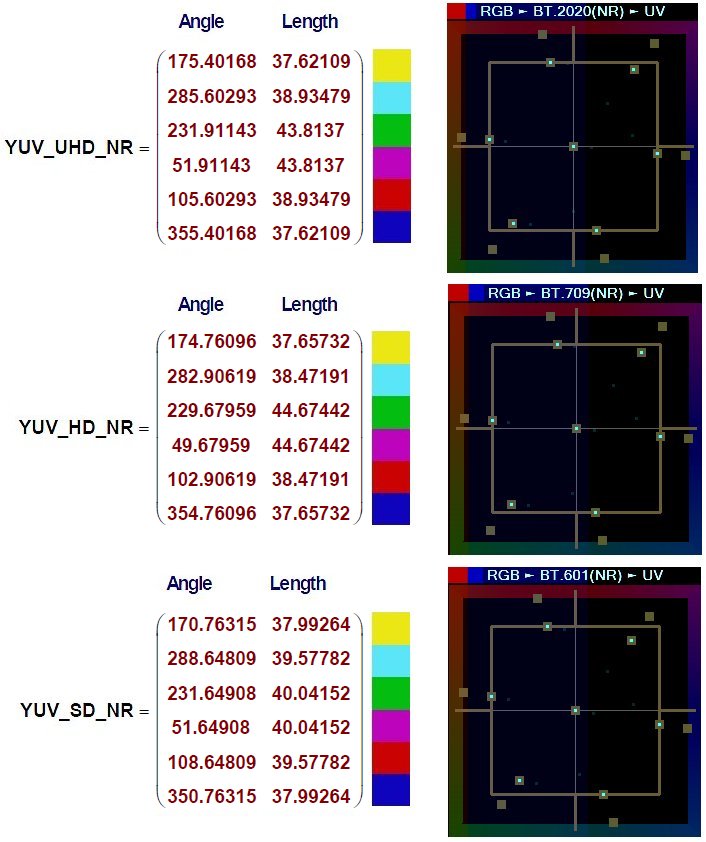
Strictly speaking, traditional Vectorscope graticule label “Saturation” has not much in common with the corresponding colorimetry parameter. Better name for this label could be “Chroma Intensity” or “Chroma Level”.
Yellow rectangles on the VQV Vectorscope tool display show measured UV “Chroma Volume”. This is quite handy for at glance checks. Note that Chroma Volume numerical value differs from UV vector length aka “Saturation”.
Full VQV Vectorscope readout text covers several measured parameters (overall UV statistics and separate statistics of U and V components). In case of pristine test pattern all readout values should be the same:
- UV Chroma Volume: 75% (U: 75% V: 75%)
- UV Peak Volume: 75% (U: 75% V: 75%)”
On the Vectorscope display all bright Cyan spots should be within the corresponding target boxes (ideally, at the central position) and UV Chroma Volume numerical readout should match the nomenclature specified for the pristine color bars test.
The target boxes layout automatically follows the color matrix type specified in the analyzed file metadata or selected by the user.
For any color space 75% and 100% target boxes are displayed, thus allowing to detect mismatch between the declared nomenclature and actual UV data.
What may happen in case of wrong YUV to RGB matrix selection? The resulting colors may appear quite different.
The special test image shown below was produced by combining 4 decoded RGB images as 4 horizontal bands:
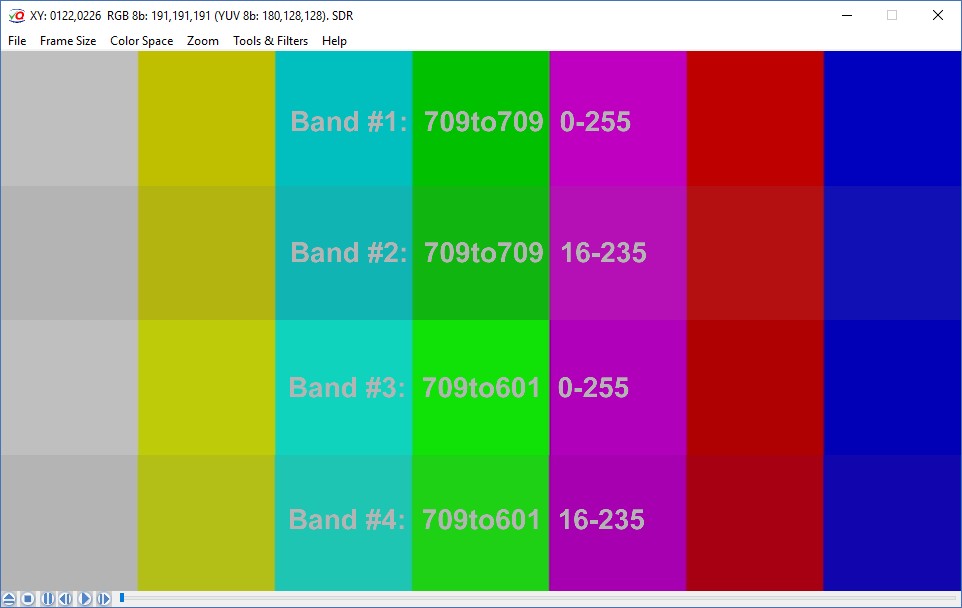
Original pristine 75% NR YUV HD Color Bars have been decoded to FR RGB in 4 modes:
- Band #1: Correct BT.709 matrix, correct mapping from NR to FR
- Band #2: Correct BT.709 matrix, wrong mapping from NR to NR
- Band #3: Wrong BT.601 matrix, correct mapping from NR to FR
- Band #4: Wrong BT.601 matrix, wrong mapping from from NR to NR
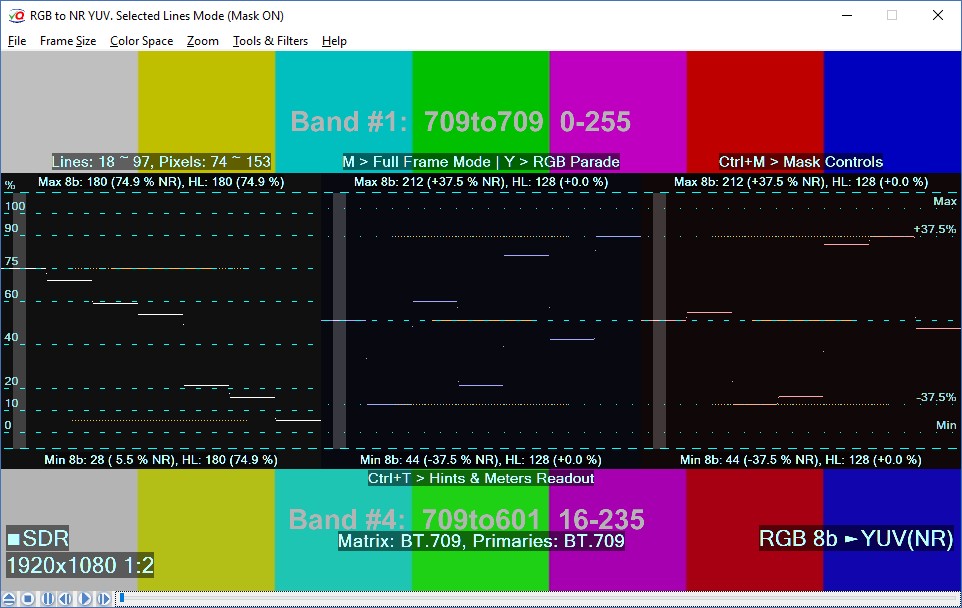
Next two VQV Waveform Monitor screenshots show strong discrepancies between correct Band #1 and wrong Band #4.
In both cases VQV was converting input FR RGB 8 bit data of the selected line range (i.e. of the selected Band #) to NR BT.709 YUV waveforms using correct built-in matrix.

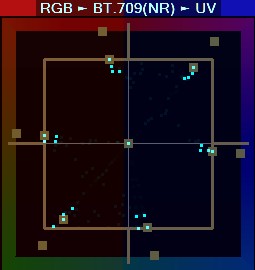
This screenshot shows UV Vectors of all 4 bands (all lines of the RGB frame):
Interesting fact – wrong colors saturation may go up or down, but the overall Chroma Volume readout shows correct 75%.
See previous posts:
Learn more:
See posts in the Video Science Fundamentals category.